Why We Compare You With Households Like Yours
"Spend no more than 30% on housing" is a good line to know. It answers only part of the question.
Most people have wondered at some point whether they're doing okay compared with people in a similar situation. It's a reasonable thing to want to know, and a hard thing to find out, because money is one of the few subjects people rarely discuss openly.
Without a point of comparison, people guess. Some assume they're behind when they're fine. Others assume they're fine when something is off. A comparison you can trust is what separates the two.
Standard rules, and another view
The usual starting point is a standard rule. Spend no more than 30% on housing. Split your take-home pay 50/30/20: needs, wants, savings. These rules are easy to remember, they give everyone the same reference point, and your Budget Blueprint uses them too.
What they can't show is how your household compares with households like it. Statistics Canada's 2024 Canadian Income Survey puts the median after-tax income of a person not living with family at $41,000, and of a couple with children (one income or two) at $133,900. The same rule reads very differently for each of them. So alongside the standard rules, your Budget Blueprint compares you with households like yours.
What your income level is
Your income level places your household's after-tax income against Statistics Canada's figures for households of the same type: a single person, a couple, a couple with children, a lone parent. Below average, average or above average.
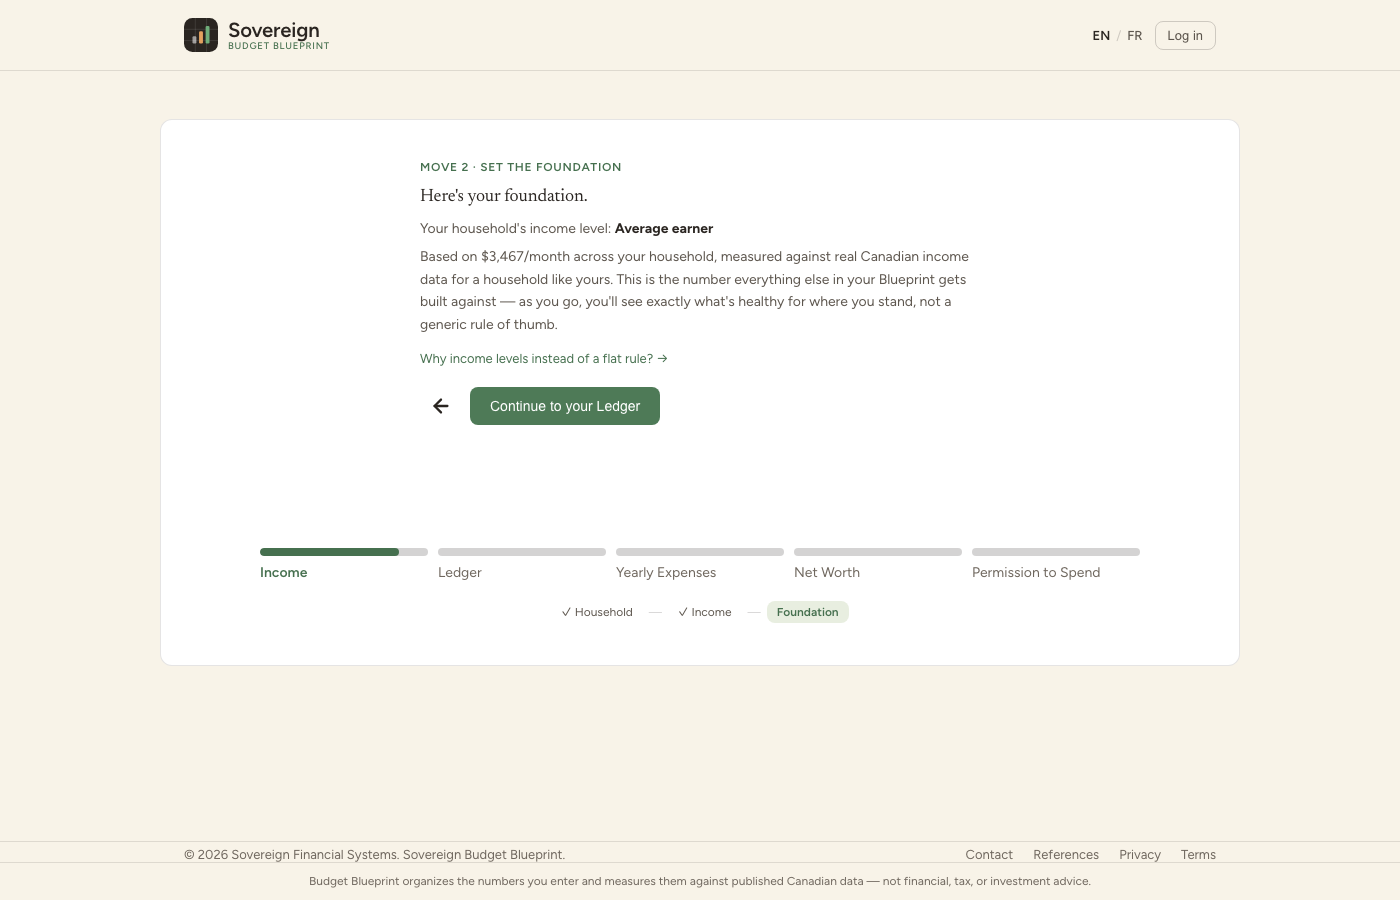
Your spending targets and saving goals are then set for your income level and your type of household.
Where the numbers come from
Seven published sources from three Canadian organizations set the spending targets:
- Statistics Canada: what Canadian households spend, category by category and by income level, from the Survey of Household Spending and the national household accounts.
- Credit Counselling Society: a national non-profit's budgeting guidelines, set as shares of take-home pay.
- The Financial Consumer Agency of Canada: the federal agency's guidance on saving, "Save 5% to 10% of your take-home pay."
Take housing. The 30% line has a source: Statistics Canada and CMHC count a household spending 30% or more of its before-tax income on shelter as living in unaffordable housing. Your Budget Blueprint uses it as an affordability line. Households with higher incomes typically spend a much smaller share on shelter, and people who live alone typically spend a larger one, so the targets reflect both.
Every source is listed on our References page, with a link to where it came from.
How we check
Where we compare, we show our source. Where we can't compare fairly, we tell you why. These are the rules behind that:
- We read every source. Before a citation goes on the References page, we go to the original and confirm it says what we say it does. When a source didn't support a target, we dropped it, even when that meant the target had to change or go.
- Every spending target is checked against what Canadians spend. If typical households at an income level would be flagged for ordinary spending, we change the target.
- Where the exact line is our call, we say so. Some targets sit within a range the data supports, with the precise edge set by us. Those are marked as our judgement.
- Where no fair comparison exists, there's no target. What you pay in professional dues, how much you give to charity, what it costs to care for your children or a parent: these depend on your own circumstances. Comparing them would tell you nothing useful, so your Budget Blueprint shows them in your totals with no target, and tells you why.
- We review every target once a year against the newest figures. If something looks off to you in between, tell us and we'll look into it.
A recent check found references that were out of date or didn't fully support their target, so we replaced them or removed the target.
Saving: a goal, not a target
The Financial Consumer Agency of Canada suggests saving 5% to 10% of your take-home pay. The 50/30/20 guideline suggests 20%. Sovereign's goal is to help everyone who's still earning get to 20% or more.
Most Canadian households save far less. Statistics Canada put the household saving rate at 4.4% at the end of 2025, and households in the middle of the income range, on average, spent more than they brought in. Statistics Canada says some lower-income households may be bridging that gap with borrowing. That isn't a reason to lower the goal. It's the reason Sovereign exists.
It's a goal to work toward. Life costs what it costs: a litre of milk, a phone plan and a tank of gas cost the same whatever you earn, so the road to 20% is longer for some households than for others. Saving more never counts against you, and saving less isn't a failing. Across your Budget Blueprint, the insights show what's already helping you get there and what could.
What Sovereign replaces
It replaces the guessing that usually comes with budgeting. You still do the work, but instead of wondering whether a number feels high, low or about right, you get an answer: where you sit compared with Canadian households like yours, using sources anyone can check.
The standard rules still have their place. They tell you whether you're following the rule. Comparing with households like yours tells you whether you're doing okay.
— The Sovereign Team